For the first 5 months of 2020, total U.S. scrap exports (including ferrous and nonferrous metals, paper, plastics, rubber, textiles, glass, etc.) by quantity were down 11% as compared to the first 5 months of 2019 to 14.1 million metric tons.
- However, by dollar value total U.S. scrap exports were virtually unchanged year-on-year at $7.9 billion during Jan-May 2020.
- Also in dollar terms, Canada was the largest export market for U.S. scrap during Jan-May 2020, with shipments valued at more than $1.1 billion, while China dropped to the 4th spot at $594 million.
- China represented the largest net loss in U.S. scrap export sales (-$355 million, from $948 million during Jan-May 2019) while the largest net gains in dollar terms this year have been to the United Kingdom, Germany, Canada, Thailand, and Bangladesh, along with Belgium, Italy, and Japan.
Ferrous
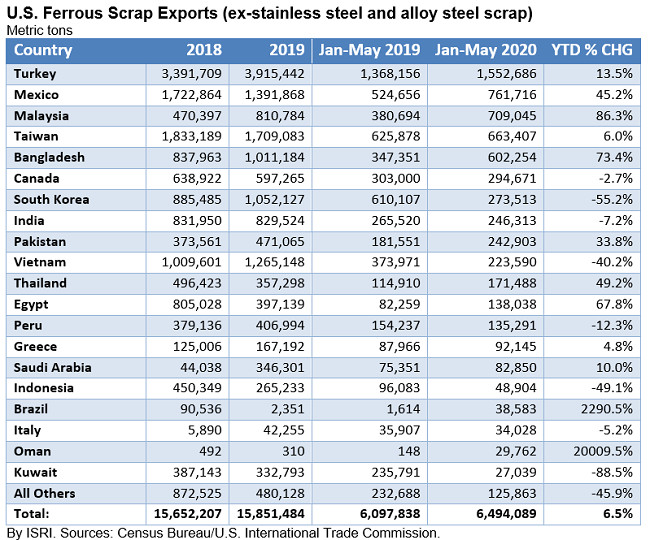
- Thanks to improved demand from Turkey, Mexico, Malaysia, Bangladesh, and Pakistan, among others, U.S. ferrous scrap exports (excluding stainless steel and alloy steel scrap) increased 6.5 percent by volume during the first five months of 2020 to nearly 6.5 million metric tons.
- U.S. ferrous scrap exports to Turkey reportedly rose 13.5% year-on-year during Jan-May 2020 to more than 1.55 million metric tons, while reported exports were also up sharply to Mexico (+45%), Egypt (+68%), Bangladesh (+73%), and Malaysia (+86%).
- In contrast, U.S. ferrous scrap exports to South Korea (-55%), Vietnam (-40%), Peru (-12%), and India (-7%) are down this year.
Nonferrous
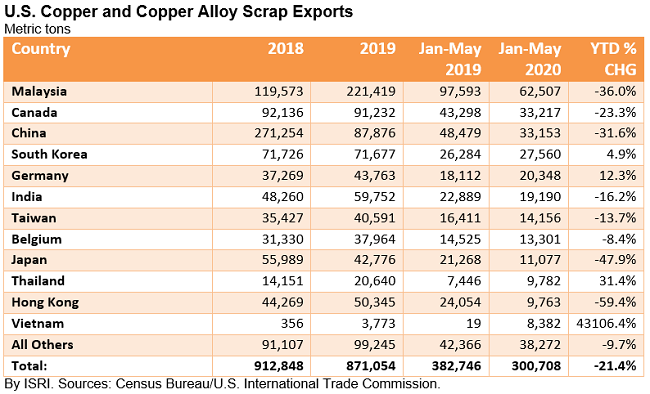
- Census Bureau trade data show U.S. copper and copper alloy scrap exports were down 21% year-on-year during the first 5 months of 2020 to just over 300,000 metric tons.
- Copper scrap exports to China were down nearly 32% for the year-to-date to just over 33,000 metric tons, third spot among the major export destinations.
- Malaysia retained the top spot for U.S. copper scrap exports at just over 62,500 metric tons during Jan-May, but trade with Malaysia was down 36 percent as compared to the first five months of 2019.
- Markets where demand for U.S. copper scrap is growing this year include South Korea (+5%), Germany (+12%), and Thailand (31%).
Recovered Paper and Fiber
U.S. recovered paper exports are down this year in three different measurements:
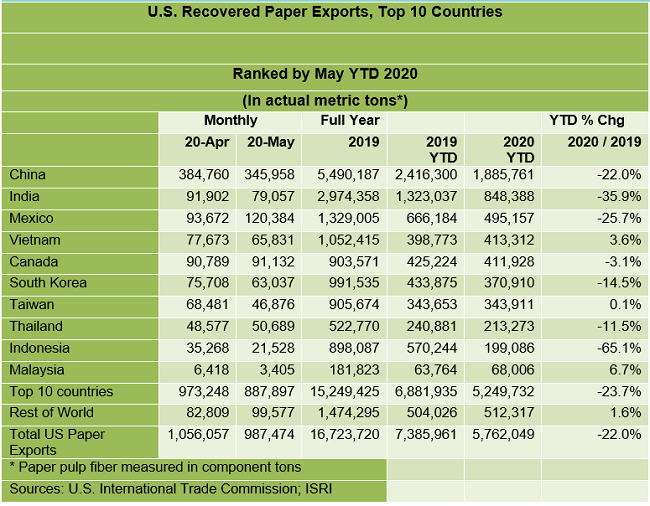
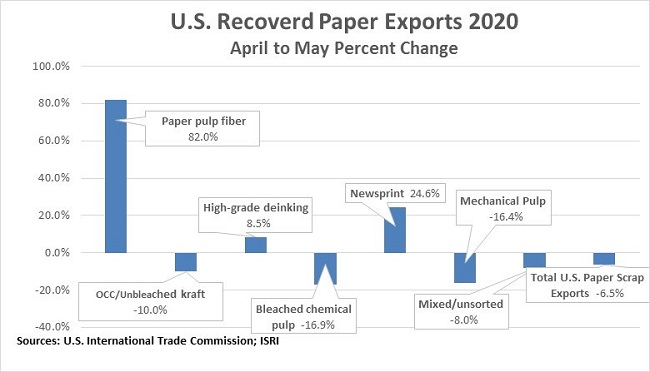
- RP exports decreased 6.5 percent to 987,474 in May 2020 as compared to the previous month.
- As compared to May 2019, year-over-year (YOY) recovered paper exports were down 35.2 percent.
- And for the first five months of 2020 compared to the same period last year, paper exports were down 22.0 percent to 5,762,049 metric tons.
The top 10 countries receiving U.S. recovered paper exports in the first five months of 2020 accounted for more than 91 percent of exports. Only three countries in the top 10 received more U.S. paper scrap exports through May 2020 than they did the same period last year:
- Malaysia up 6.7 percent;
- Vietnam up 3.6 percent; and
- Taiwan up 0.1 percent.
U.S. exports increased for several paper scrap commodities in May 2020 from the previous month:
- Paper pulp fiber exports nearly doubled, rising 82 percent;
- Newsprint exports increased nearly 25 percent; and
- High-grade deinking exports increased 8.5 percent.
Plastics
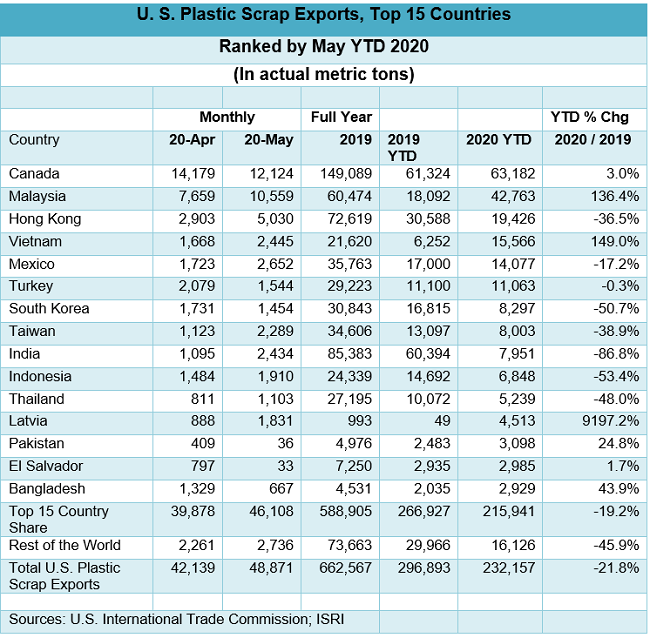
- U.S. plastic scrap exports increased 16 percent to 48,871 metric tons in May 2020 compared to the previous month, reversing consecutive monthly declines.
- May, year-over-year (YOY), U.S. plastic exports were down more than 23 percent.
- And for the first five months of 2020 compared to the same period last year, U.S. plastic scrap exports were down 21.8 percent to 232,157 metric tons.
- The concentration of the top 15 countries receiving U.S. plastic scrap exports increased to 93.0 percent for the year-to-date, up from 89.9 percent in the corresponding period last year.
- Canada remains the top country followed by Malaysia, Hong Kong, and Vietnam.
- Notable percentage increases for 2020 YTD compared with 2019 YTD:
- Latvia’s 9,197 percent increase, to 4,513 metric tons, and approaching the top 10 countries
- Vietnam’s 149 percent increase to 15,566 metric tons
- Malaysia’s 136 percent increase to 42,763 metric tons
