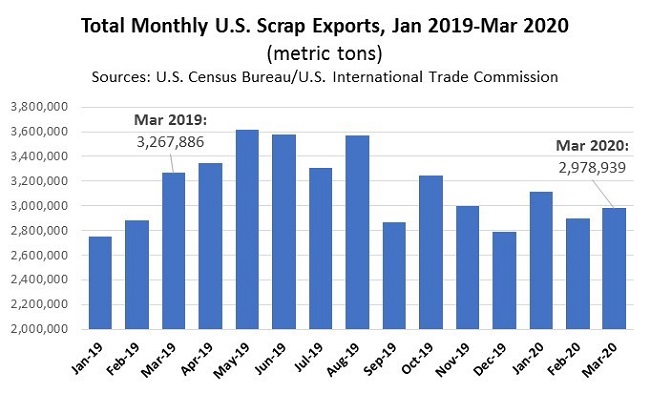
Trade data released by the Commerce Department show total U.S. scrap exports (including ferrous scrap, nonferrous scrap, recovered paper and fiber, plastic scrap, rubber scrap, glass cullet, etc.) came in at just under 3 million metric tons in March 2020, up from the February volume but down 8.8% as compared to one year prior.
First quarter 2020 scrap exports of just under 9 million metric tons were little changed (up around 1%) as compared to the first quarter of 2019, when shipments got off to an extremely slow start to the year in Jan-Feb. In dollar terms, the Commerce Dept. data show U.S. scrap exports were up 11% year-on-year in the first quarter of 2020 to $5.1 billion thanks largely to higher prices for precious metal scrap and heavier loadings of ferrous scrap.
Ferrous
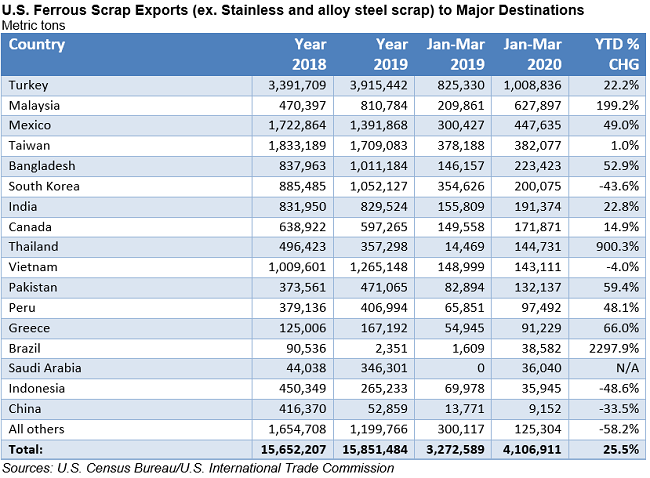
For Q1 2020, U.S. ferrous scrap exports (excluding stainless and alloy steel scrap) increased more than 25 percent year-on-year to 4.1 million metric tons. The gains came on the back of significant YTD gains to Turkey, Malaysia, Mexico, Bangladesh, Thailand, Pakistan and other markets. Ferrous scrap volumes to mainland China remain negligible.
Reminder: Don’t miss our Ferrous Spotlight Webinar to be held on May 14, 2020 at 1 pm Eastern when Brandi Harleaux from South Post Oak Recycling Center, Blake Hurtik from Argus Metal Pricing, and ISRI’s Joe Pickard discuss how recyclers are responding to the COVID-19 crisis and the outlook going forward for the domestic & global steel and ferrous scrap markets.
Nonferrous
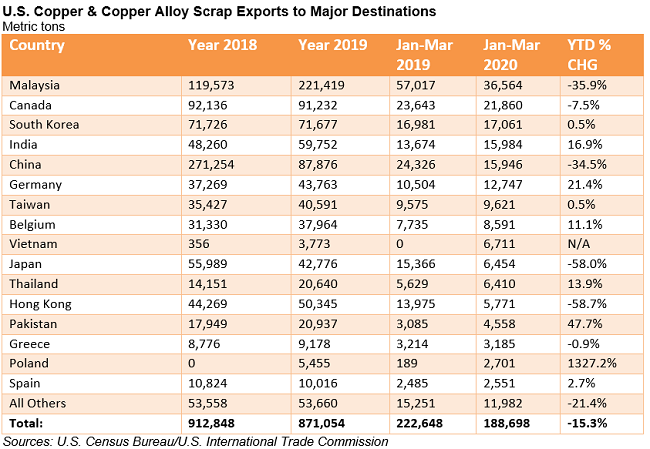
U.S. nonferrous scrap exports continue to shift away from mainland China to other markets. After having taken in the lion’s share of U.S. base metal scrap exports for years, China has dropped to the 5th spot among the major destinations for both U.S. copper and aluminum scrap exports. For the YTD, copper & copper alloy scrap exports were down 15.3% year-on-year due to weaker sales to Malaysia, Canada, China, Japan, and other markets, more than offsetting improved business with India and Europe.
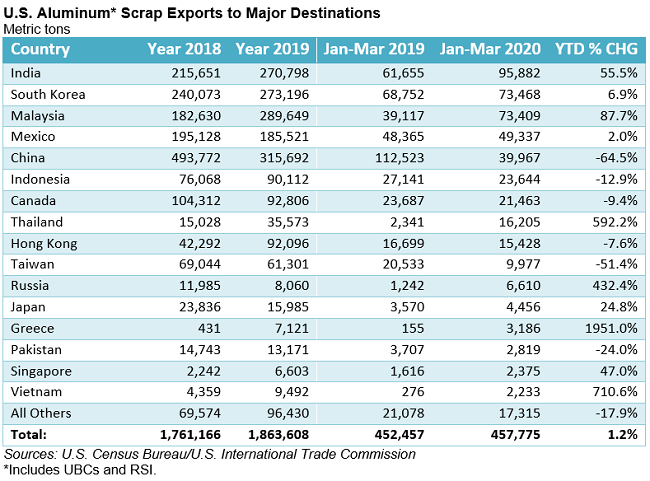
U.S. aluminum scrap exports (including UBCs and RSI), were up just over 1% Y-o-Y during Jan-Mar 2020 thanks to improved demand from India, Malaysia, Thailand and others that counter-balanced reduced shipments to mainland China (-64.5%), Taiwan (-51.4%), and Hong Kong (-7.6%).
Recovered Paper and Fiber
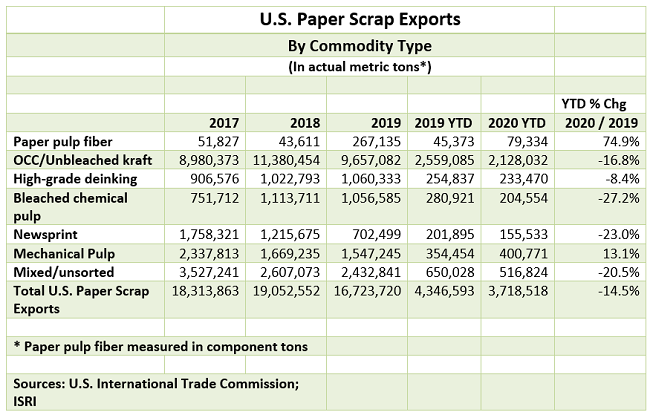
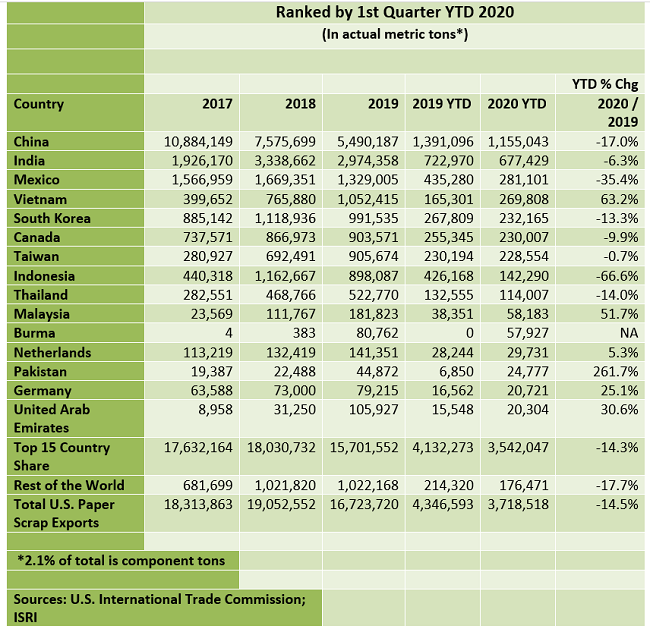
U.S. recovered paper and fiber exports decreased 14.5 percent in the 1st quarter 2020 to 3,718,518 metric tons, down 628,075 metric tons from the same period a year ago.
The top 15 countries receiving U.S. recovered paper exports accounted for 95 percent of total exports in the first quarter 2020, the same as a year ago. Burma and Pakistan joined in the top 15 countries in 2020, replacing Italy and Columbia who were in the top 15 a year ago. Notice that Burma didn’t receive any U.S. paper scrap exports a year ago and now ranks 11th.
U.S. Paper Scrap Exports, Top 15 Countries
U.S. RP Exports by Commodity Type
The largest commodity component, OCC/unbleached kraft, accounted for 57.2 percent of all U.S. RP exports in the first quarter, down 1.7 percent from the same period a year ago. In the first quarter 2020, exports of this commodity decreased nearly 17 percent from a year ago to 2,128,032 metric tons.
A couple paper commodity types showed increases in the 1st quarter 2020. Following more than a six-fold increase exports in the full year of 2019, paper pulp fiber increased nearly 75 percent in the 1st quarter 2020 compared with the same period last year. The other commodity increasing during the 1st quarter 2020, mechanical pulp, increased over 13 percent to 400,771 metric tons.
