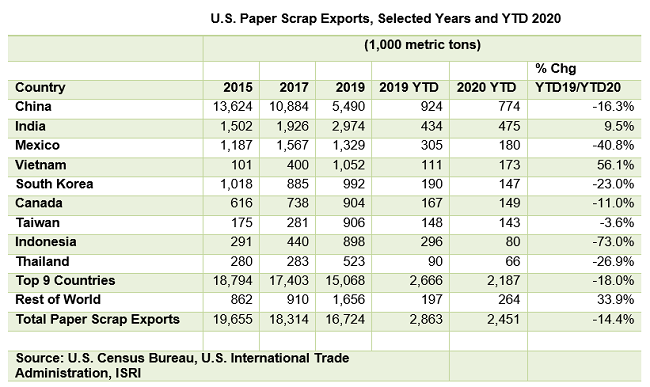
The latest U.S. trade data released by the Census Bureau are through February 2020, which in most cases do not yet capture the full trade and transportation impacts caused by the spread of the coronavirus. But here’s a recap of the major U.S. export flows by commodity through February at least.
We’ll have a recap of the March trade flows for you next month.
- Total U.S. scrap exports were up 6.6% by volume year-on-year during Jan-Feb 2020 to just over 6 million metric tons;
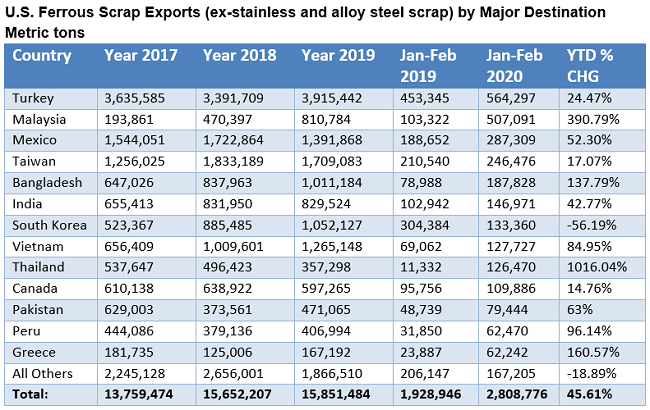
- But that's almost entirely due to the spike in ferrous scrap exports (+45% YTD) that went to a number of countries, in particular Malaysia, but also Thailand, Turkey, Bangladesh, Mexico, Vietnam, and India;
- That spike in ferrous scrap exports is widely expected to come down in light of trade and travel restrictions in those growth markets;
- Other key commodity groups like paper (-14% YTD) and nonferrous scrap (-2%) were down for the YTD;
- Despite reports of China being more active in the scrap market given their reduced domestic collection volumes, total U.S. scrap exports to China during Jan-Feb 2020 were down more than 20 percent as compared to Jan-Feb 2019.
Ferrous Scrap
The first two months of 2020 saw a surge in U.S. ferrous scrap shipments to Malaysia, Bangladesh, Thailand, Vietnam, Turkey, and other markets, according to figures from the Census Bureau, bringing total ferrous scrap exports up more than 45 percent by volume as compared to Jan-Feb 2019. Of note, the trade data show that the U.S. shipped less than 5,000 tons of ferrous scrap to China during Jan-Feb 2020. On a related note, Fastmarkets AMM reports that “China’s ferrous scrap market plummeted during the past three weeks due to destocking pressure on sellers coupled with low procurement rates among mills, which sent prices to their lowest in close to two years. Fastmarkets’ price assessment for steel scrap heavy scrap domestic, delivered mill China was 2,200-2,360 yuan ($313-335) per tonne including value-added tax last Friday April 10, down by 210-230 yuan per tonne from 2,430-2,570 yuan per tonne a week earlier. This is also 440-490 yuan per tonne lower than the assessment of 2,690-2,800 yuan per tonne at the beginning of this year.This is the lowest that the prices have been since July 2018, according to Fastmarkets’ pricing database, MInD.”
Nonferrous Scrap
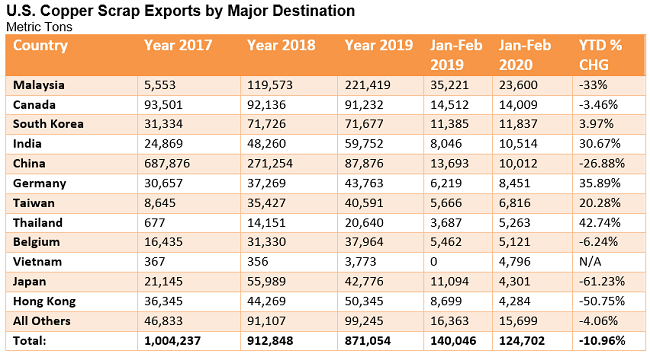
Copper and copper alloy scrap exports were down nearly 11% year-on-year by volume during Jan-Feb 2020 as shipments to Malaysia were down by a third and exports to mainland China and Hong Kong were down sharply. This week, Fastmarkets AMM reports that “A total of 222,020 tonnes of copper scrap has been approved for import into China in a fifth round of metal scrap import quotas, according to a release from the China Solid Waste & Chemicals Management Bureau on Friday April 10. The latest quota is significantly larger than the 3,520 tonnes approved in the fourth round and brings the total amount of copper scrap approved by the bureau since July 2019 up to 527,611 tonnes. But the approval for such a large amount of imported scrap is not expected to ease the existing tightness of such material in China given the difficulty sourcing scrap from abroad amid continued coronavirus-related lockdowns, market sources told Fastmarkets.”
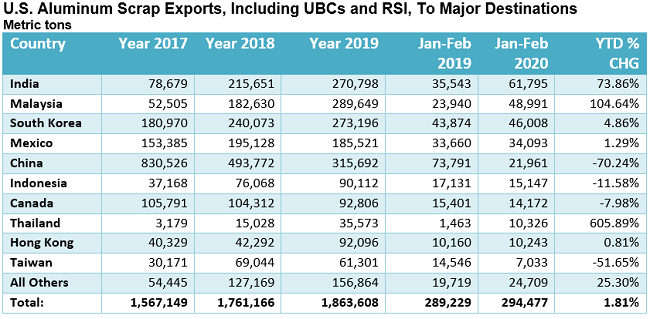
In contrast to copper, the Census Bureau figures show U.S. aluminum scrap exports during Jan-Feb 2020 were up 1.8% as increased sales to India and Malaysia, among others, were offset by the 70% plunge in shipments to mainland China. Again, these trade patterns are changing significantly and we’ll have an update for you next month on the March trade flows. Here in the U.S., the Aluminum Association reports on the 232 front that, “According to the Association’s most recent update to the Subreport on Trends in 232 Product Exclusions, as of March 31st 2020, 11,004 exclusions have been granted (20.6B lbs); 2,437 denied (13.7B lbs); and 3,277 are pending (16.2B lbs). Through the first 3 months of 2020, 5.6B lbs of exclusions have been granted, while 25.2 percent of that volume included an objection. China continues to outpace the rest of the world in terms of the volume of exclusions granted, and has an 80.7 percent success rate. Overall import volumes of covered products decreased 11.0 percent y/y, and have contracted 3.6 percent YTD.”
Plastic Scrap
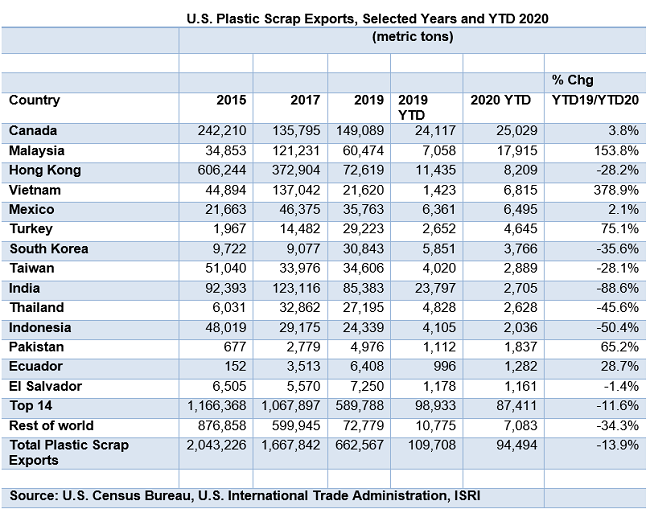
U.S. plastic scrap exports declined in the first two months of 2020 by 13.9 percent to 94,494 metric tons compared to the first two months of 2019. However, two types of plastic scrap showed year over year gains: vinyl chloride scrap up 166 percent and polystyrene scrap up 20 percent. These two plastics types, together, account for 19 percent of plastic scrap exports so far in 2020.
The top 14 countries receiving U.S. plastic scrap exports YTD Feb 2020 accounted for 93 percent of the 94,494 metric tons. Canada remains the number one U.S. plastic scrap export country receiving more than 25,000 metric tons YTD Feb 2020, an increase of 3.8 percent from YTD Feb 2019. Malaysia received nearly 18,000 metric tons, a 153.8 percent increase from YTD Feb 2019 and Hong Kong received over 8,200 metric tons, down 28 percent from YTD 2019.
For the entire year of 2019, U.S. plastic scrap exports were down 38.3 percent from 2018 to 662,567 metric tons. In 2014, plastic scrap exports peaked at 2,172,382 metric tons.
Recovered Paper
U.S. recovered paper and fiber exports declined in the first two month of 2020 by 14.4 percent to nearly 2.5 million metric tons compared to the first two months of 2019. However, two types of paper scrap showed year over year increases: scrap paper pulp up 64.4 percent and scrap paper nesoi up 19.3 percent. These two types of paper scrap, combined, only account for less than 13 percent of paper scrap exports for YTD Feb 2020. The top nine countries receiving U.S. paper scrap export YTD Feb 2020 accounted for 89 percent of the 2.5 million metric tons. China continues to receive the most U.S. paper scrap exports thus far in 2020, receiving 924,000 metric tons, down over 16 percent from YTD Feb 2019. India received 475,000 metric tons, an increase of 9.5 percent from YTD Feb 2019 and Mexico received 180,000 metric tons, down nearly 41 percent from YTD Feb 2019. For the entire year of 2019, U.S. recovered paper exports declined 12.2 percent from 2018 to 16.7 million metric tons. In 2011, U.S. recovered paper and fiber exports peaked at 21.1 million metric tons.
