Ferrous Scrap Exports
U.S. ferrous scrap exports, excluding stainless steel and alloy steel, grew by a modest 1.2% in 2019 to nearly 15.9 million metric tons as improved shipments to Turkey, Malaysia, Saudi Arabia, Vietnam, Bangladesh, and others more than offset weaker business with Egypt, China, and Mexico.

Turkey not only retained its place as the largest export destination for U.S. ferrous scrap, but also posted the largest net volume gain (+524,000 mt to more than 3.9 million tons) last year, according to Census Bureau trade data. Here are the top 5 market gains and losses for U.S. ferrous scrap exporters last year:

Stainless Steel Scrap Exports
Despite improved demand from India, Taiwan, and Malaysia, U.S. stainless steel scrap exports plunged 27 percent lower in 2019 to just under 474,000 metric tons in 2019 due to reduced trade volumes with Canada, China, Mexico, and, to a lesser extent, Vietnam and Japan. According to the Census Bureau trade data, that’s the lowest volume of U.S. stainless steel scrap exports since 2002, further compounding an already difficult year for U.S. stainless scrap processors and brokers.

Nonferrous Scrap Exports
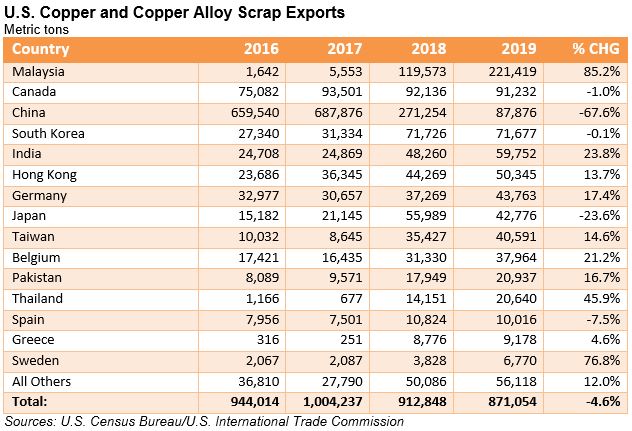
China continued to reshape the global nonferrous scrap market last year as U.S. copper & copper alloy scrap exports to mainland China plunged by two-thirds to just under 88,000 metric tons in 2019. For comparison’s sake, the U.S. exported nearly 688,000 tons of copper scrap to China in 2017. The surge in shipments to Malaysia (+85% to 221,429 mt) and improved demand from India, Germany, Taiwan, Belgium, Thailand, Sweden, and a few others helped to offset the reduced business with China. But for 2019 overall, U.S. copper scrap exports were reportedly down 4.6% to 871,000 metric tons.

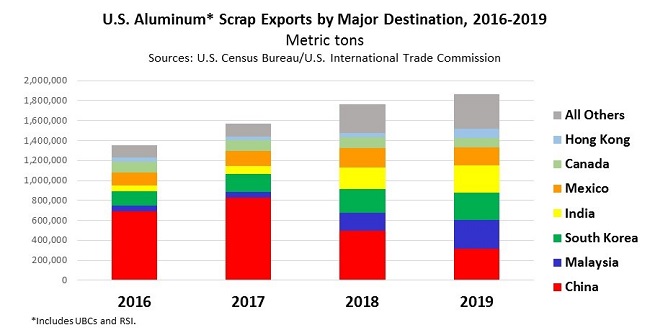
Unlike with copper, the U.S. trade data show aluminum scrap (including UBCs and RSI) exports from the United States increased 5.8% by volume in 2019 to 1.86 million metric tons as the 36 percent drop in shipments to mainland China was more than offset by heavier loadings for Malaysia, South Korea, India, and Hong Kong.

Plastics
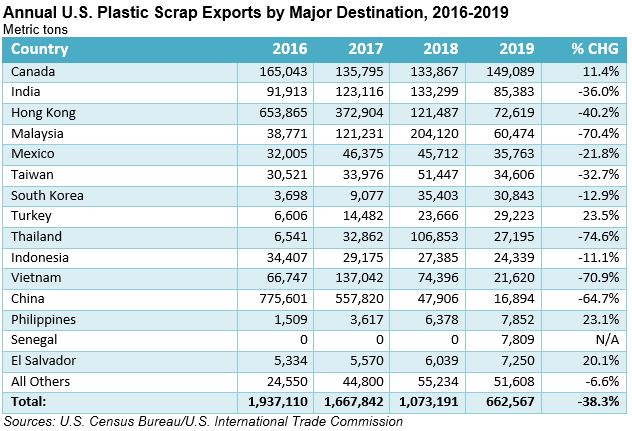
Not too surprisingly, plastic scrap exports from the United States had the worst performance among the major scrap commodities last year, falling 38 percent by volume to less than 663,000 metric tons as shipments to virtually every major market declined last year, save Canada and Turkey. As compared to 2016 when the U.S. shipped more than 1.4 million tons of plastic scrap to China and Hong Kong combined, the volume to those 2 destinations fell to less than 90,000 metric tons last year. Plastic scrap shipments to Malaysia, Thailand, and Vietnam were all down more than 70 percent last year.

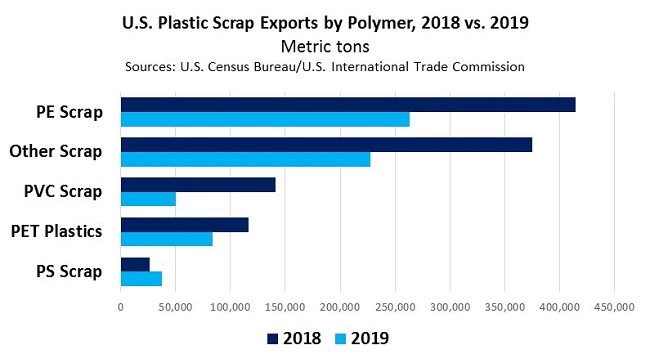
By polymer and volume, exports of polyethylene scrap had the sharpest drop last year, falling by more than 150,000 metric tons, followed by “other” plastic scrap (-147 kt), PVC scrap (-91,000 kt), and PET scrap (-33 kt). The only polymer to register an increase was polystyrene scrap exports, which were up by 11,000 tons to nearly 38,000 metric tons.

Editor’s note: We’ll have a full recap of last year’s recovered paper and fiber exports as part of our special Focus on Paper in the next ReMA Market Report.