For U.S. nonferrous scrap market participants, uncertainty in China continues to complicate already challenging market conditions. According to Census Bureau trade data, U.S. copper scrap exports to China averaged 12,000 tons per month in Apr-May, up from just over 5,000 mt in January as shippers moved more material ahead of the July 1 deadline. But for the year-to-date, copper scrap exports to China are down more than 75 percent and shipments overall are down 2 percent despite expanded trade with Malaysia, Canada, South Korea, India, Japan, and others. Of note, copper scrap exports to Hong Kong were reportedly up 47 percent during the first 5 months of the year.
U.S. Copper and Copper Alloy Scrap Exports by Major Destination
Metric tons
There have been significant shifts not only in overall copper and copper alloy scrap export volumes by destination, but also within the different grades of copper scrap as processors and exporters respond to changes in product flows and elevated consumer quality demands. For example, here are the biggest shifts in overseas demand for No. 2 copper scrap from the U.S. so far this year.
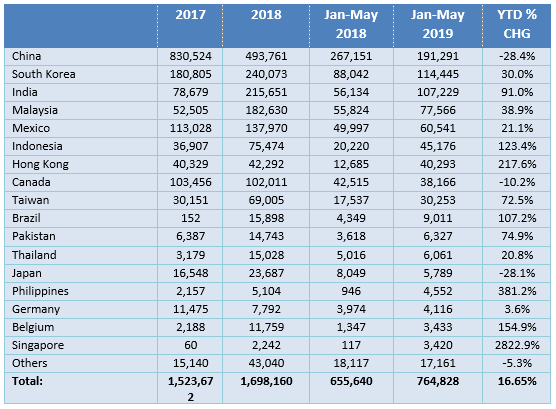
Of note, the solid flow of aluminum scrap globally has outpaced the depressed movement to mainland China (-28%) this year. Year-to-date, U.S. aluminum scrap exports to India are up more than 90 percent through May, along with significant gains to South Korea (+30%), Malaysia (+39%), Indonesia (+123%), Taiwan (+73%), and Mexico (+21%). Overall, U.S. aluminum scrap exports are up nearly 17% this year:
U.S. Aluminum Scrap Exports by Major Destination
Metric tons

Sources: U.S. Census Bureau/U.S. International Trade Commission