Despite a sharp decline in U.S. exports to China, total U.S. scrap exports increased 13 percent by value to $20.3 billion and were up 7 percent by volume to 40.6 million metric tons in 2018.
By commodity, ferrous scrap exports had the largest volume gain (+1.9 million mt to 15.6 million mt) while plastic scrap exports saw the sharpest decline (-36 percent to 1.1 million mt).
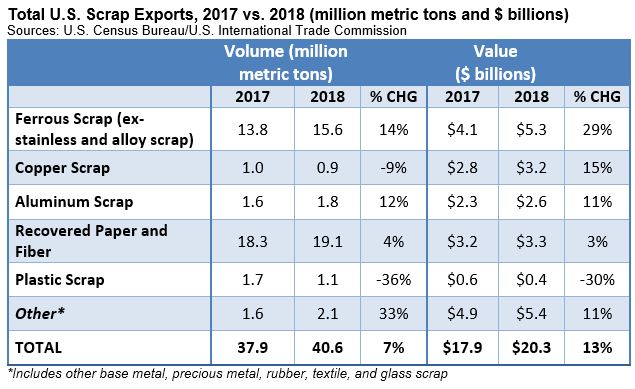
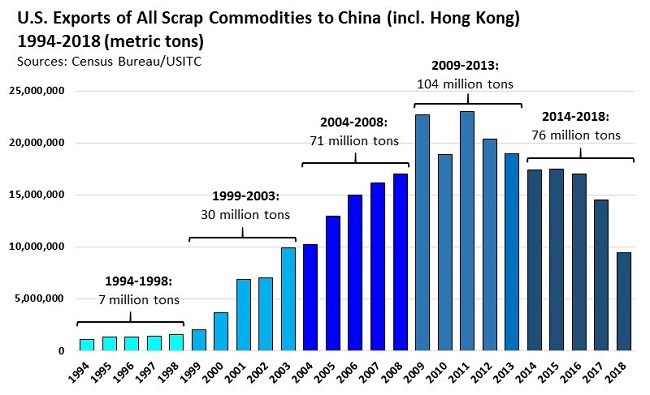
As China’s import restrictions kicked in, U.S. exports of all scrap to mainland China declined 38 percent by value to $3.5 billion in 2018, a decrease of nearly $2.2 billion as compared to 2017. Including Hong Kong (which is treated as a separate export destination), the volume of U.S. exports to China fell to their lowest level since 2002:
Even with the sharp decline in Chinese demand, China remained the biggest market for U.S. scrap exports. The top 5 markets in dollar value for U.S. scrap were as follows:
- China – $3.5 billion (-38%)
- Canada – $2.3 billion (+6%)
- India – $1.5 billion (+63%)
- Mexico – $1.4 billion (23%)
- South Korea – $1.2 billion (+60%)
As U.S. scrap exporters developed new markets in response to China’s pullback, India became the largest growth market last year in terms of net gain in export sales by value. The top 5 overseas growth markets for U.S. scrap exporters last year were as follows:
- India: up $586 million to $1.5 billion
- Malaysia: up $550 million to $736 million
- Taiwan: up $498 million to $1.1 billion
- South Korea: up $465 million to $1.2 billion
- Germany: up $319 million to $1.2 billion
Other top growth markets in 2018 included the U.K., Mexico, Indonesia, Belgium, Japan, Vietnam, Egypt, Canada, Thailand, and Bangladesh.
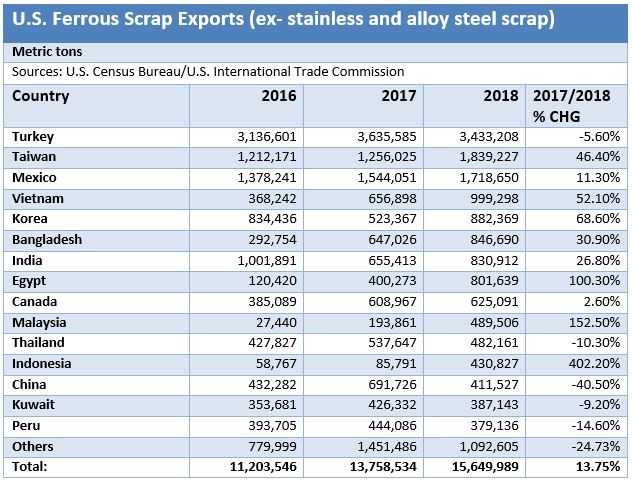
Ferrous – Among the major scrap commodity groups, U.S. ferrous scrap exports saw the largest gain last year, increasing nearly 14 percent to 15.6 million metric tons. Turkey remained the largest export market for U.S. ferrous scrap in 2018, importing more than 3.4 million metric tons, following by Taiwan, Mexico, Vietnam, and South Korea according to official trade statistics from the U.S. Census Bureau:
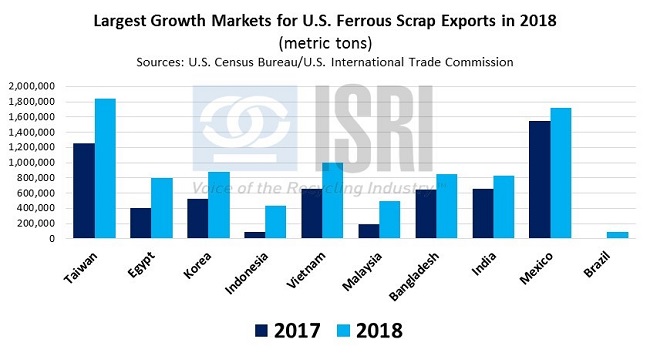
But last year’s gains in ferrous scrap exports was not driven by Turkey. In fact, the largest net market gains (by volume) were in Taiwan (+583 kt), Egypt (+401 kt), S. Korea (+359 kt), Indonesia (+345 kt), Vietnam (+342 kt), Malaysia (+296 kt), and Bangladesh (+200 kt), along with gains to India, Mexico, and Brazil.
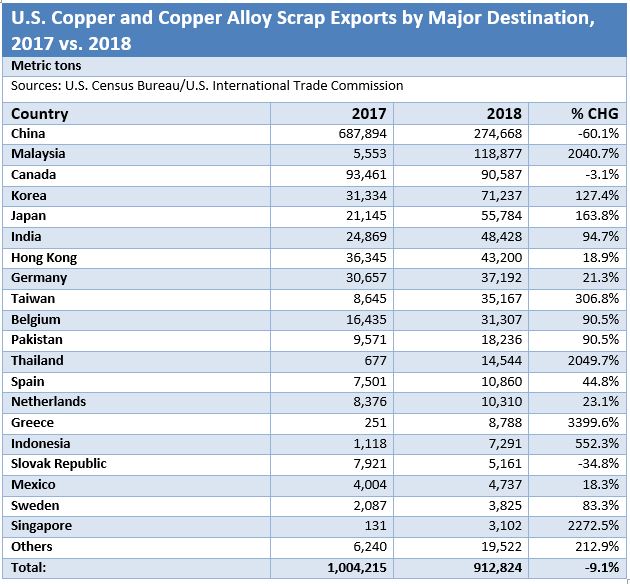
Nonferrous – U.S. nonferrous scrap exports last year were more clearly impacted by Chinese scrap import restrictions. According to the Census Bureau data, U.S. exports of copper and copper alloy scrap to mainland China declined 60 percent by volume last year to just under 275,000 metric tons, pulling U.S. copper scrap exports 9 percent lower last year despite gains to other markets.
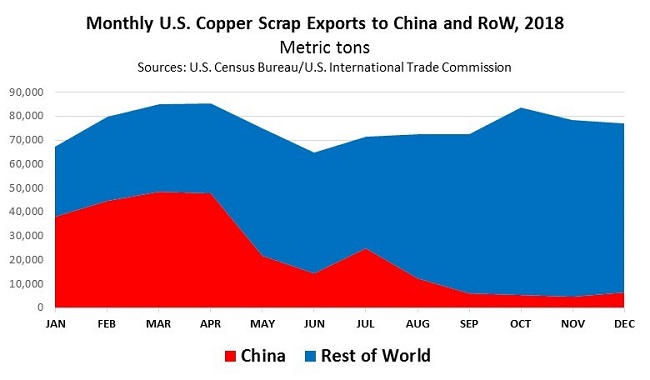
The downward trend in copper and copper alloy scrap exports to China was especially pronounced in the second half of 2018. As compared to the first quarter of 2018 when U.S. copper scrap exports averaged around 44,000 metric tons per month, by the 4th quarter of 2018 that volume was reduced to around 5,000 tons per month:
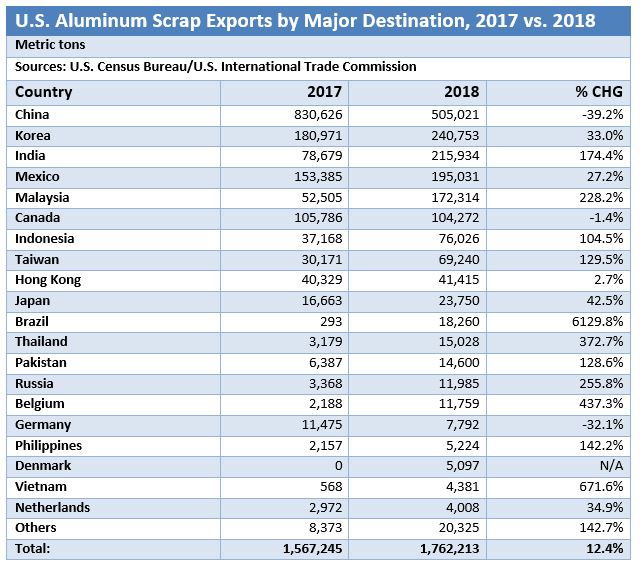
U.S. aluminum scrap exports to China also slowed sharply over the course of 2018. But unlike copper, the Census Bureau trade data show that other markets more than made up for the drop-off in Chinese demand as total U.S. aluminum scrap exports (including UBCs and RSI) rose 12 percent last year to 1.76 million metric tons thanks in part to gains to India, Malaysia, Indonesia, Taiwan, and other markets:
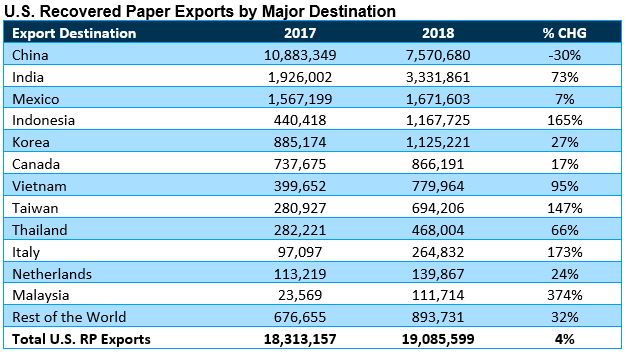
Paper and Plastic – U.S. export data for recovered paper and scrap plastics recently released by the U.S. Census Bureau show total U.S. recovered paper exports were up 4 percent by volume in 2018 while plastic scrap exports declined 36 percent. By RP grade, pulp substitutes (+49%) and OCC (+27%) enjoyed the largest gains:
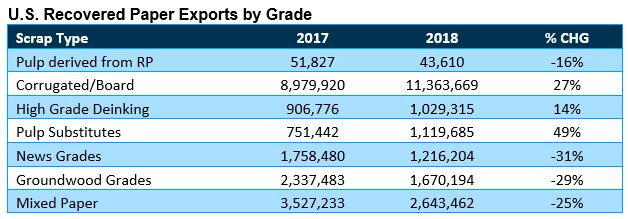
The considerable declines in news, groundwood, and mixed paper grades can be attributed to China’s import restrictions on recyclables. The restrictions account for virtually all of the increases made in corrugated/board grade exports of recovered paper as processors are readjusting their sort to create more OCC than SRPN or MP.
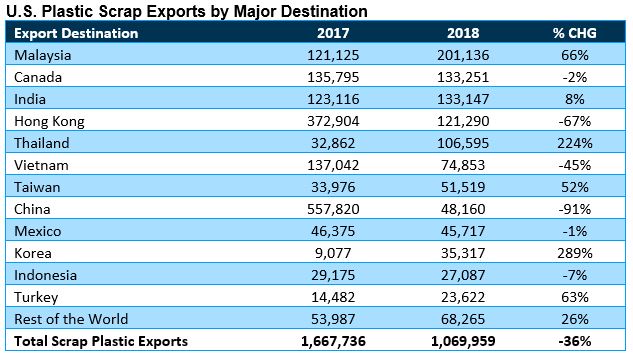
On the plastic scrap front, the Census Bureau data show exports to mainland China plummeted 91% last year, more than offsetting gains to Malaysia, India, Thailand, Taiwan, South Korea, and other markets. As a result, U.S. plastic scrap exports were down 36 percent by volume last year to less than 1.1 million metric tons while plastic scrap exports declined 30 percent in dollar value terms.
For more information, please contact ReMA Research Analyst Bernie Lee.
Back to Main