In both value and volume terms, total U.S. scrap exports advanced in 2017 as improved demand for ferrous and nonferrous metal scrap more than offset weaker demand for non-metallic scrap (from China in particular). According to recently released Census Bureau data, U.S. exports of all scrap commodities including scrap metal, paper, plastics, textiles, tire & rubber, etc., rose to 37.9 million tons valued at $17.9 billion last year, an 8.6% increase in dollar terms. Here’s a breakdown of the latest U.S. scrap export trends and developments by major commodity group:
Nonferrous
China’s implementation of reduced “carried waste” thresholds for nonferrous scrap starting March 1 remains squarely in focus despite numerous unanswered questions. Among those questions are: what exactly constitutes carried waste; whether a one percent threshold can be effectively (and consistently) implemented; and whether import license cuts will be geared mainly toward mixed metal shipments or for all nonferrous scrap commodities. The difference between scrap and waste remains a critical distinction. As was brought up by a former ReMA Chair at the ReMA Trade Committee meeting in late January, a shipment of No. 2 copper that is 96 percent copper does not mean the remaining 4 percent is waste as it very likely contains other valuable metals.
Although U.S. copper and copper alloy scrap exports to mainland China did trail off in the 4th quarter of 2017 (down 10 percent year-on-year), for 2017 as a whole shipments to China advanced nearly 4 percent. Overseas demand also improved in Hong Kong, Korea, Japan, Malaysia, Canada, and Mexico last year, helping to boost U.S. copper scrap exports 6.2% in 2017 and above the 1 million ton mark for the first time since 2014 according to the latest Census Bureau trade data.

Unlike the slowdown in 4th quarter copper scrap exports to mainland China, U.S. exports of aluminum scrap to China surged 32 percent higher year-on-year (as compared to the 4th quarter of 2016) to more than 230,000 metric tons during Oct-Dec 2017. As a result, aluminum scrap shipments to China jumped 18.5% higher for 2017 overall, helping to lift total U.S. aluminum scrap exports (including UBC’s and RSI) 15.8% higher to nearly 1.57 million metric tons. Other growth markets for aluminum scrap last year included Korea, Mexico, India, Hong Kong, Indonesia, and Germany according to the Census data:
Ferrous
U.S. ferrous scrap exports (excluding stainless steel and alloy steel scrap) had their best annual performance since 2014, climbing 23% higher year-on-year by volume to 13.8 million metric tons valued at over $4.1 billion in 2017. Improved demand from Turkey (+16%), Vietnam (+93%), China (+60%), Pakistan (+65%), Bangladesh (+111%), Mexico (+12%), and others contributed to last year’s gains:

Recovered Paper and Fiber
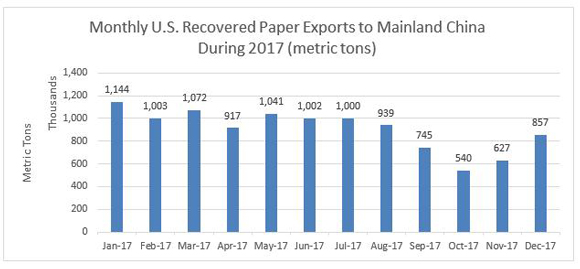
Following China’s notification to the World Trade Organization in July that mixed/unsorted RP imports into the country would be banned, recovered paper export prices (and mixed paper prices in particular) were pressured sharply lower. That reversed significant price gains earlier in the year. As a result, while the total volume of U.S. recovered paper exports dropped from 19.8 million metric tons in 2016 to just over 18.3 million metric tons in 2017, the price strength in the first half of the year carried the dollar value of U.S. recovered paper and fiber exports 1.4% higher to more than $3.2 billion in 2017 thanks in part to stronger sales to India, Mexico, Canada, Indonesia, and Vietnam:


Plastic Scrap
Not surprisingly, U.S. plastic scrap exports were hit hardest by the Chinese import restrictions announced last year. Plastic scrap export sales to mainland China and Hong Kong dropped 32% and 38%, respectively, in dollar terms in 2017. As Chinese plastic scrap purchases plummeted, the total volume of U.S. plastic scrap exports fell 14 percent to 1.67 million metric tons, the lowest level since 2008.
The drop-off in Chinese import demand for plastic scrap was especially dramatic late in the year: